March sees all happiness indicators decline, and over half of workers in Canada say that an increase in compensation would improve their happiness in the workplace.
TORONTO--(BUSINESS WIRE)--The ADP Canada monthly Happiness@Work Index (“Index”), celebrating its first anniversary this month, finds workers’ happiness decline in March, with all secondary indicators reporting a decrease compared to February and falling below levels registered in March of last year.
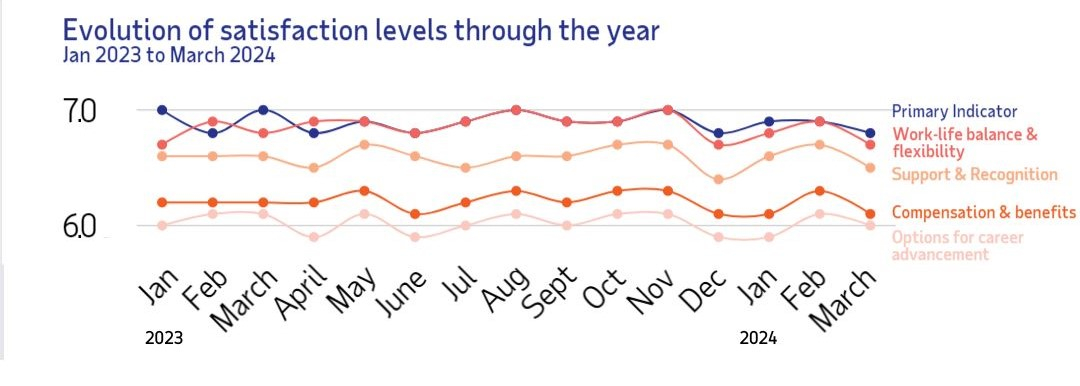
The National Work Happiness Score for March 2024 is 6.6/10, representing a decrease of 0.1 points from February and slightly below the March 2023 score (6.7/10).
“Over the past year, happiness levels across regions and generations saw their highs and lows. Lower scores in February, April and June gave way to higher scores in August and November before dipping during the back-to-school and winter seasons,” comments Heather Haslam, vice president of marketing at ADP Canada. “This highlights that the needs and expectations of workers in Canada are fluid and can be sensitive to external factors. While a few indicators, notably work-life balance and flexibility, continued to come out on top month-over-month, others, such as options for career advancement, remained low. Employers must stay connected to these trends to create a positive and engaging work environment for all employees.”
March 2024 Happiness@Work Index Highlights
In March, the primary indicator of worker happiness declined to 6.8/10, a 0.1 point decrease from February, as forty-three per cent of workers in Canada surveyed feel satisfied in their current role and responsibilities. While all secondary indicators report a reduction in score this month, work-life balance and flexibility remain the highest sentiment score.
The Index also indicates that while Boomers (7.2/10) remain the happiest generation for the 15th consecutive month, they record the steepest decline this month (-0.5). Millennials are now the least happy generation at work, with a score of 6.5/10, while Gen X and Gen Z tie at 6.6/10. Regionally, Québec (6.8/10) reclaims its position as the happiest region but reports a 0.1 point decrease from February, while Atlantic Canada (6.5/10) drops from first to third place in March. Ontario (6.6/10), despite historically low regional scores to date, was the only region this month to show an increase in happiness.
National Work Happiness Score: Generational Snapshot
Regional Work Happiness Score Snapshot
This month’s Index also reveals the importance of compensation as more than half (57%) of workers surveyed say they would feel happier in the workplace if they got a raise, and over a third (35%) indicate a bonus would make them happier. Additionally, 31 per cent of workers in Canada report that more vacation days or time off would help improve their overall happiness at work.
“Compensation remains a top concern for workers nationwide,” adds Haslam. “Inflation is ever-present, and one of the external factors we suspect has impacted happiness levels over the past year. As employers and workers navigate economic changes, tools that support pay transparency, clear lines of communication and regular check-ins with employees can help workers feel secure and confident in their current role.”
About the Happiness@Work Index Methodology
The Happiness@Work Index is measured monthly through a survey fielded by Maru Public Opinion on behalf of ADP Canada and is undertaken by the sample and data collection experts at Maru/Blue. The survey is run in the first week of each reported month for consistency purposes and asks over 1,200 randomly selected employed Canadian adults (including both employees and self-employed individuals) who are Maru Voice Canada online panelists to rate workplace factors on a scale from 1 to 10. Discrepancies in or between totals when compared to the data tables are due to rounding.
The results are weighted by education, age, gender and region (and in Québec, language) to match the population, according to Census data. This is to ensure the sample is representative of the entire adult population of Canada. For comparison purposes, a probability sample of this size has an estimated margin of error (which measures sampling variability) of +/-2.8%, 19 times out of 20.
The Index will continue to be published on the last Wednesday of the month, with the next scheduled findings due for publication on Wednesday, April 24, 2024.
About ADP Canada
Designing better ways to work through cutting-edge products, premium services and exceptional experiences that enable people to reach their full potential. HR, Talent, Time Management, Benefits and Payroll. Informed by data and designed for people.
For more information about ADP Canada visit www.adp.ca or follow us on Instagram adp_canada.
*Variation against February 2024 scores
Contacts
For further information:
Hayley Suchanek
Kaiser & Partners
289-681-2477
hayley.suchanek@kaiserpartners.com
